Physics89L
Notes and materials for Week 4
Topics covered: Gaussian distribution and p-values.
- Course material
Data analysis topics
This week we are going to be discussing the Gaussian distribution and how we use it to interpret the statistical significance of a result.
These topics are covered in chapters 2 and of: “Measurements and Their Uncertainties : A Practical Guide to Modern Error Analysis” which is available online via the Stanford bookstore. You don’t need to read those chapters, but you may find them a useful reference, and they present the material in a somewhat different way than we will be presenting it, which you might find more intuitive.
Scientific context and resources
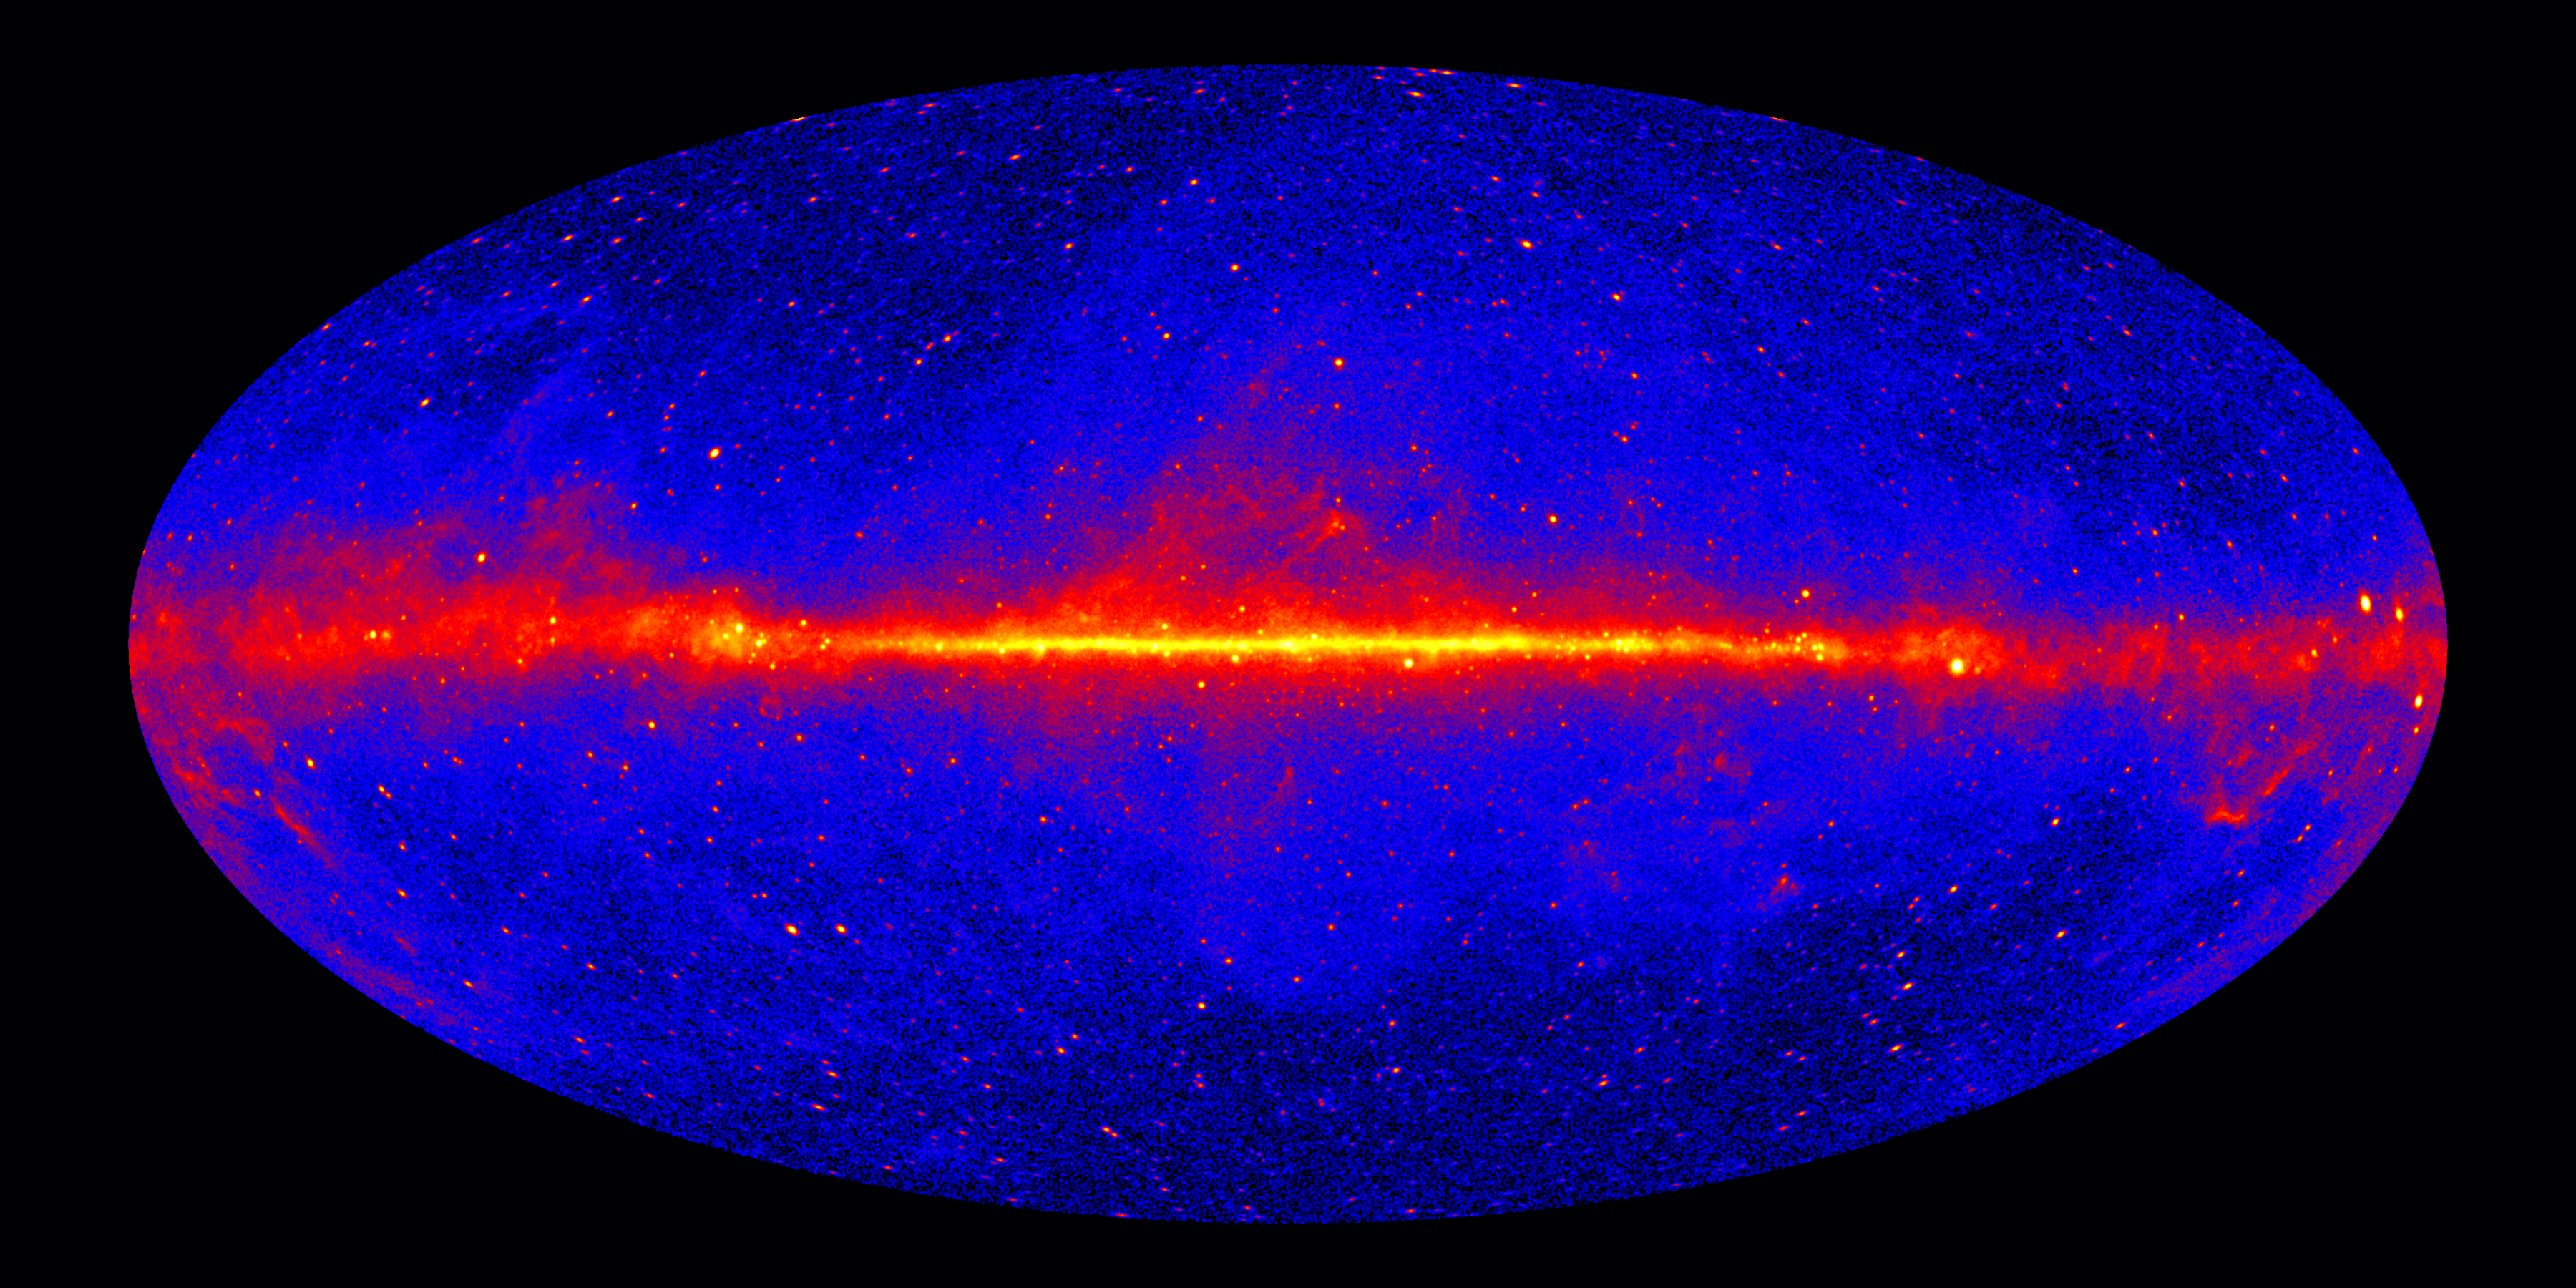
In the second Jupyter notebook we will be using the output of some data analysis done using data from the Fermi Gamma-ray space Telescope. As you might expect from the name, “Fermi” observes gamma rays coming from the sky. In general, only the most extreme environments, such as explosions, the cores of galaxies, and extremely dense objects such as neutron stars, produce enough gamma rays to be seen from the Earth. This is what the Fermi sky looks like:
Many of these extreme environments are also extremely variable. I.e., in the case of an explosion, you might suddenly see a bright source that wasn’t there the day before. It turns out the cores of galaxies can exhibit variability on timescales of hours to days to weeks. One important aspect of the Fermi mission is to detect when these objects flare up and notify astronomers with other telescopes so they can study them while they are flaring.
The reason this is possible is that Fermi telescope can see about one-fifth of the sky at any one time, and scans the entire sky every 3 hours.
Python functions reference
We will not be using a lot of new python functions this week. Here are the important ones that we will be using.
| Function Name | What it does |
|---|---|
| numpy.random.poisson | generates a random integer from a “Poisson” distribution |
| scipy.stats.norm | Interact with a Gaussian distribution |
| plt.annotate | Add text to a plot |
| datetime.datetime.fromtimestamp | Converts time from seconds since a reference to a format with year, month, day, etc…, which matplotlib uses to make nice plot axis labels |
| np.argmax | Find the index of the largest element in an array |